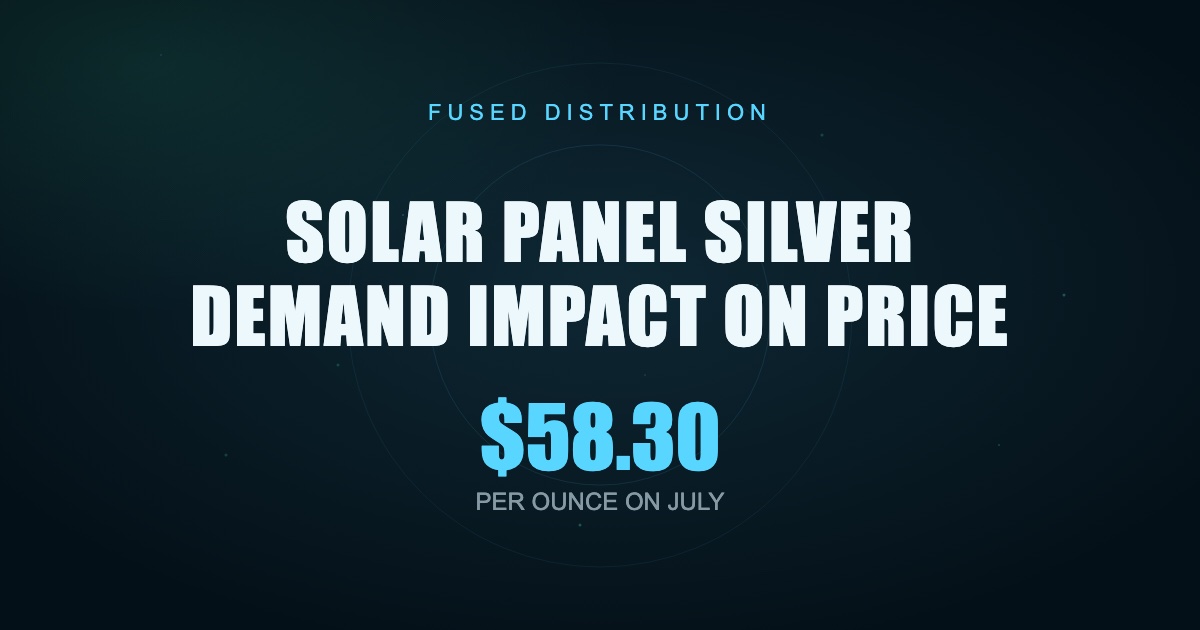
Solar panel manufacturing pulled roughly 232 million ounces of silver in 2025, and that single sector now drives more of silver's price action than any other industrial buyer (Source: pv magazine / World Silver Survey 2026). Silver spot sits at $58.30 per ounce on July 1, 2026 (Source: Silver Institute live spot reference), and if you are trying to figure out whether to buy now or wait, the solar story is the one you need to understand first. We stock physical silver at Fused Distribution, and we watch this demand curve every week because it moves what you pay at the counter.

Here is the short version. Solar demand is huge, it is still growing in total ounces even as each panel uses less silver, and the market has run a structural deficit for five years running. That combination puts a floor under the price. It does not guarantee a moonshot, but it does mean the downside case is weaker than it was a decade ago.
Why Solar Went From Side Story To Main Character
In 2014, photovoltaic production was a rounding error inside silver's industrial demand column. Ten years later it is the biggest single line item. Solar's share of total silver industrial demand climbed from around 5% in 2014 to over 20% in 2024 (Source: The Silver Institute). That is a four-fold jump in a decade, and it happened while total industrial demand itself was growing.
You should care about that shift because it changes how silver trades. Silver used to move mostly on jewelry buying, film photography, and investor mood. Now a chunk of the demand is tied to a policy-driven, subsidy-supported, capacity-expanding industry that plans capex years in advance. That kind of buyer does not stop ordering because spot ticked up two dollars. They keep buying because they have modules to ship.
For you as a retail buyer, that means the demand side of the equation is less flighty than it used to be. When solar factories in China, India, and the United States are running 24 hour shifts, they are pulling silver out of the market whether or not you or I buy an American Eagle this month.
The Thrifting Story, And Why It Is Not The Whole Story
Every year, panel manufacturers try to use less silver per cell. This is called thrifting. They redesign paste formulas, switch to copper-plated contacts on some cell architectures, and shave microns off the silver lines that carry current across the panel. It works. Grams of silver per panel keep falling.
The Silver Institute forecasts PV silver demand will decline in 2026 compared to 2025 as thrifting bites harder (Source: Silver Institute, World Silver Survey 2026). If you only read that headline, you would assume the solar story is cooling off and prices should soften.
That is where you need the second data point. Global solar capacity installed in 2025 grew fast enough to nearly offset per-cell thrifting on a total-ounces basis (Source: GoldSilver citing World Silver Survey 2026). More panels shipped means more total silver pulled, even if each panel sips less. So the year-over-year decline in PV silver demand is real but modest, not a collapse.
Here is the useful framing. Thrifting is a slow grind. Capacity growth is a fast wave. As long as the wave keeps rolling, the grind cannot pull the tide out.
Silver Is Now A Meaningful Cost In A Solar Panel
If you want proof that solar makers cannot just wave silver away, look at their own cost sheets. Silver made up roughly 14% of total solar panel production cost in 2025, up from 5% in 2023 (Source: BloombergNEF via Nasdaq). That is not a rounding error inside their bill of materials anymore. That is a line item their CFOs argue about.
When silver becomes 14% of your cost stack, two things happen. You push hard on thrifting, which we already covered. You also hedge, stockpile, and buy forward, because a spike from $58 to $75 wrecks your margins on modules you already priced and sold. That buying behavior tightens the physical market faster than the paper spot number suggests.
You feel this at the retail level as sticky premiums. When industrial buyers are hoovering up 1000 ounce bars, the refiners have less capacity to run American Eagles and Canadian Maples. Premiums on sovereign coins stay firm even when spot pulls back. If you have wondered why your local dealer's premium on Eagles has not compressed the way it did in 2019, this is a big part of the answer.
The Deficit That Will Not Quit
The Silver Institute projects 2025 will mark the fifth consecutive year of structural market deficit, meaning total demand exceeds new mine supply plus recycling (Source: The Silver Institute). Five years in a row. That is not a blip. That is a pattern.
Deficits get covered by drawing down above-ground stocks: ETF holdings, exchange vaults, private hoards. Those stocks are finite. Every year the deficit continues, the buffer thins. At some point the market has to reprice to bring more supply online or destroy some demand. Solar buyers are the least price-sensitive demand in the stack, so demand destruction likely comes from investment buyers pulling back or jewelry demand softening, not from panel makers walking away.
What this means for you: waiting for a big correction to load up may not work the way it did in past cycles. The floor keeps getting raised because the deficit keeps drawing down the buffer.
What This Means For Your Buying Plan
Enough context. Here is what to actually do with this information.
Set a target allocation before you buy anything. A common starting point for a beginner precious metals sleeve is 5% to 10% of your investable assets, split between gold and silver. If you are more bullish on industrial demand stories, tilt heavier to silver. If you want lower volatility, tilt heavier to gold.
Use the gold-silver ratio to time your silver-versus-gold buys. Divide gold spot by silver spot. When the ratio is above 80, silver is historically cheap relative to gold and worth accumulating. When it drops below 60, gold becomes the better relative buy. At $58 silver and roughly $3,400 gold in mid-2026, the ratio is near 58, which is on the low end of the last five years. That suggests you should not be dumping your entire cash pile into silver at this exact moment. Layer in instead.
Dollar cost average with a fixed monthly buy. Pick a number you can commit to for 24 months. $200, $500, $1000, whatever fits. Buy on the same day each month. Do not try to trade around spot moves. The behavioral trap is trying to time bottoms and ending up sitting in cash while the price grinds higher.
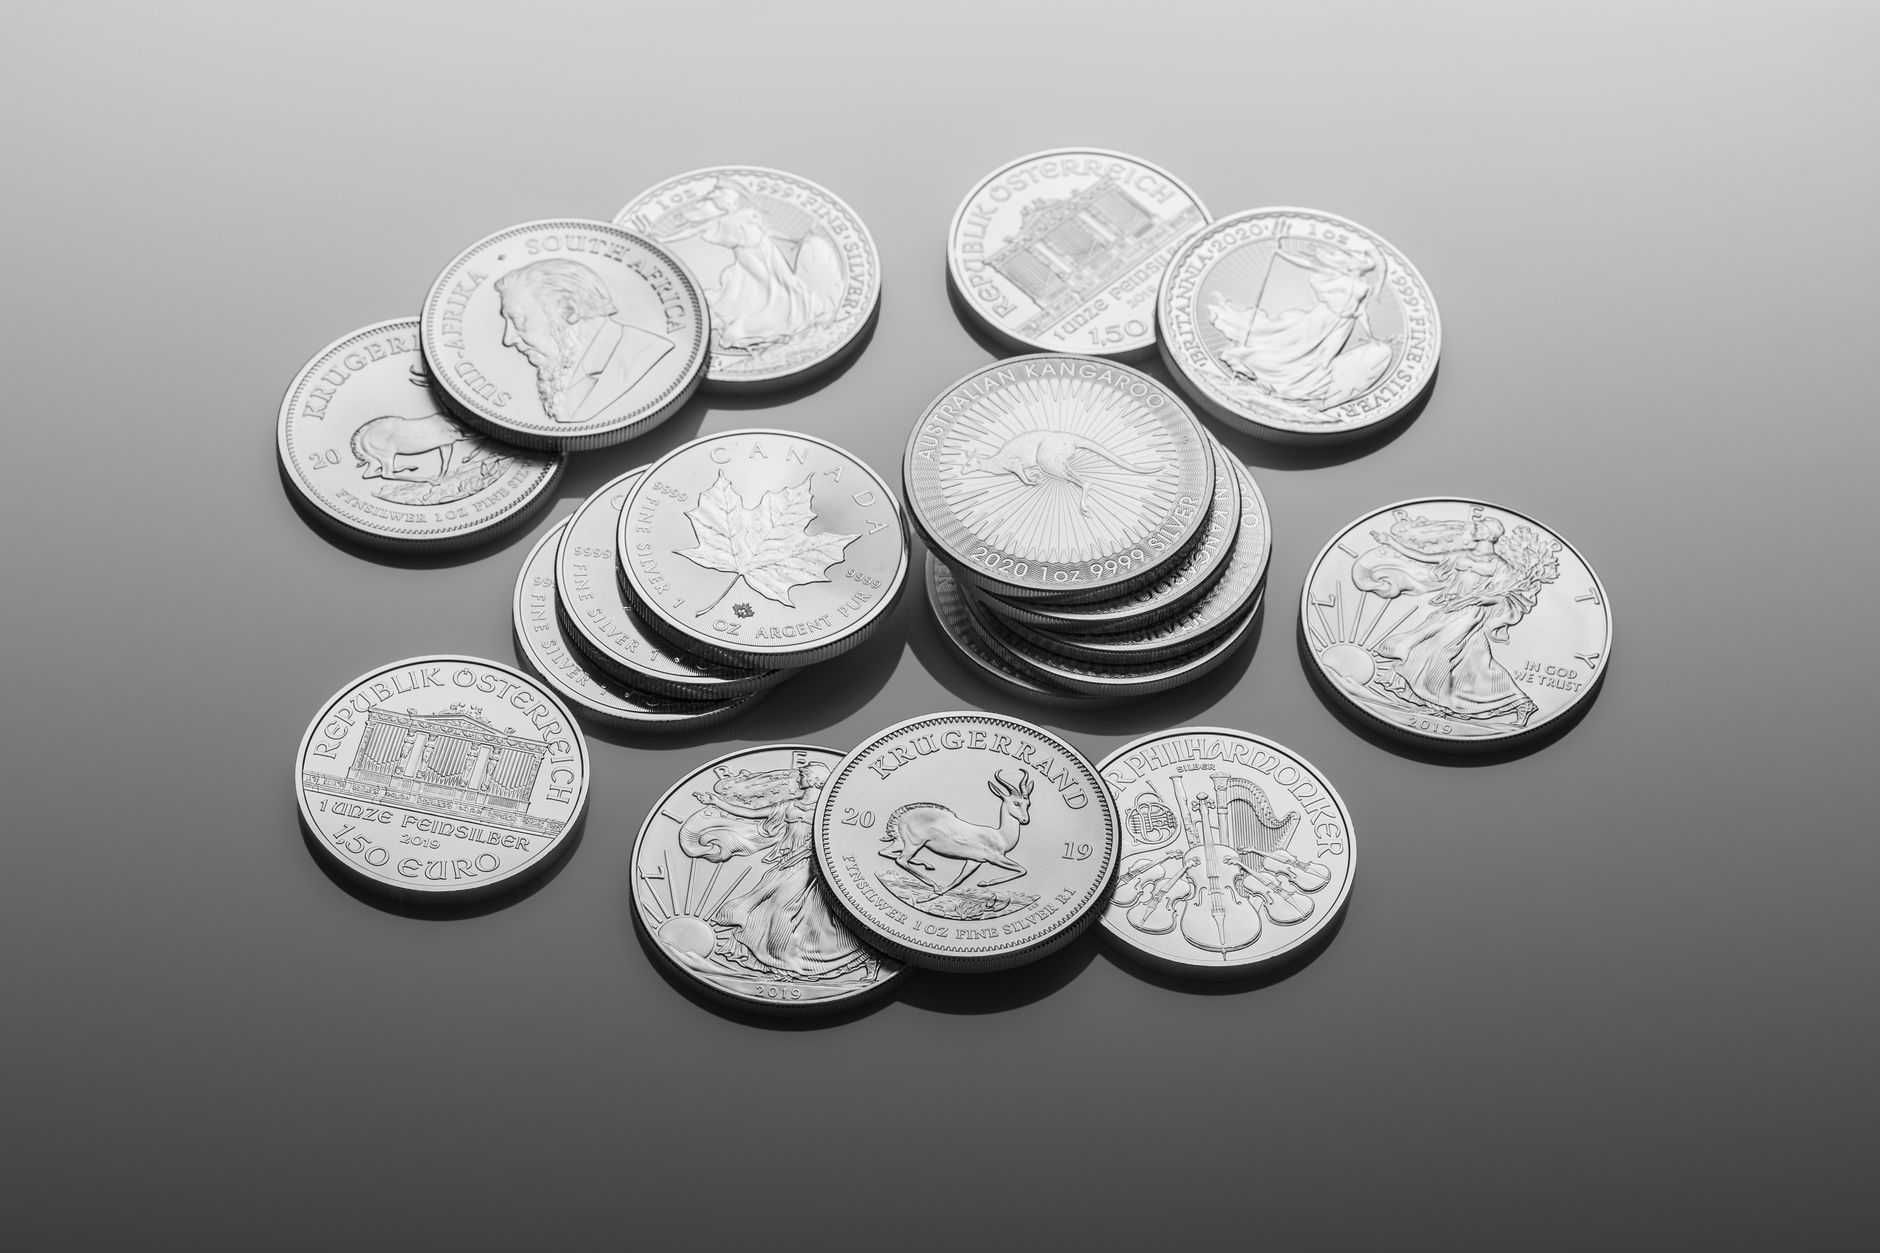
Buy the right products for your goal. If you want maximum silver per dollar, buy 10 ounce or 100 ounce bars from mints you recognize. If you want liquidity and easy resale to any dealer, buy American Silver Eagles or Canadian Silver Maples. If you want fractional flexibility, buy 1 ounce rounds from a reputable private mint. Do not mix collector premiums into an investment stack. Numismatic coins are a different sport.
Compare total delivered cost, not just premium over spot. Add the premium, shipping, insurance, and any card fees. Divide by ounces. That gives you your true cost per ounce. A dealer with a slightly higher premium but free insured shipping often beats a lowball ad price that adds $30 at checkout.
How To Read The Next 12 Months
Watch three numbers if you want a simple dashboard. Track spot silver weekly. Track the gold-silver ratio weekly. Track quarterly solar installation reports from the International Energy Agency or BloombergNEF.
If spot pulls back to the low $50s while the gold-silver ratio pushes above 65, that is a signal to accelerate your monthly buy. If solar installation reports show capacity growth stalling because of tariff fights or policy shifts, that is a signal to pause and reassess whether the demand pillar is cracking. So far in 2026, neither signal is flashing. Installations are growing, spot is firm, and the ratio is stable.
We stock the products that fit each of the goals above at Fused Distribution, and we publish our all-in delivered price so you can do the math yourself. If you are new to buying physical silver, start with a single 10 ounce bar or a tube of 20 American Eagles. Get comfortable with the delivery process, the packaging, and the storage decision before you scale up your monthly commitment. The demand story behind silver is not going away this quarter. You have time to build the stack the right way.