Silver traded near $1.29 per ounce for most of the 1800s under the U.S. bimetallic standard, hit a nominal peak of about $49.45 in January 1980 during the Hunt brothers squeeze, retested that level at $48.70 in April 2011, and now sits in a structurally higher range driven by solar panel demand and shrinking above-ground stockpiles. If you want one number to anchor your buying decisions, use the 50-year inflation-adjusted average of roughly $25 to $28 per ounce. Anything below that range is historically cheap. Anything above $35 deserves patience.
At Fused Distribution we stock physical silver because the history rewards holders who buy on the boring weeks, not the loud ones. You can reserve your first piece at /reserve/.
The Four Eras That Shaped Silver Pricing
Silver's modern price record breaks into four distinct periods, and each one teaches you something different about how to buy.
The monetary era ran from 1792 to 1964. Congress fixed silver at $1.29 per ounce under the Coinage Act, and U.S. dimes, quarters, and half dollars contained 90% silver. When the Treasury stopped minting circulating silver coins in 1965, the link between silver and the dollar broke. Any pre-1965 dime in your change jar today contains 0.0723 ounces of pure silver, worth roughly 20 times its face value at current spot.
The Hunt era ran from 1973 to 1980. Brothers Nelson and William Hunt accumulated an estimated 100 million ounces of physical silver and silver futures contracts. The price rocketed from under $2 in 1973 to $49.45 in January 1980. The CFTC and COMEX changed margin rules, the Hunts went bankrupt, and silver collapsed back to $11 by year-end. The lesson is direct. Parabolic moves end fast, and concentrated positions get unwound by rule changes.
The industrial flat-line ran from 1981 to 2005. Silver traded in a $4 to $7 channel for over two decades. Photography consumed roughly 25% of annual silver demand, and digital cameras killed that source through the 2000s. If you had bought at $5 in 1993 and held to 2024, you would have made roughly 6 times your money, beating the S&P 500's price-only return over the same window.
The supply-deficit era began in 2021. The Silver Institute has reported five consecutive years of structural deficits, with 2024 demand exceeding mine and recycling supply by roughly 182 million ounces. Solar panel manufacturing alone consumed about 232 million ounces in 2024, up from 50 million in 2014.
What The Inflation-Adjusted Chart Actually Shows
Nominal prices lie to you. A 1980 dollar bought what about $3.90 buys today. When you inflation-adjust the 1980 peak of $49.45, you get roughly $193 per ounce in 2026 dollars. The 2011 peak of $48.70 adjusts to about $68. Today's price near $30 sits well below both real-dollar highs.
Run this calculation yourself. Take any historical silver price, multiply by the CPI ratio between then and now, and you get the real cost. The St. Louis Fed's FRED database publishes both the silver fix and CPI series for free. You can pull a 50-year chart in under five minutes.
Three numbers worth memorizing:
- Real-dollar 50-year median: roughly $14 per ounce
- Real-dollar 50-year mean: roughly $17 per ounce
- Inflation-adjusted 1980 peak: roughly $193 per ounce
When silver trades below the median, you are buying at a historical discount. When it trades above the mean, you are paying a premium for momentum.
The Gold-Silver Ratio Tells You When To Switch
The gold-silver ratio is how many ounces of silver buy one ounce of gold. The 100-year average sits near 53. The 50-year average sits near 65. The ratio hit an extreme of 125 in March 2020 during the COVID liquidity crunch. It currently runs near 80.
Use the ratio as a switching signal:
- Ratio above 80: silver is cheap relative to gold. Favor silver purchases.
- Ratio between 55 and 80: neutral. Buy based on price targets, not ratio.
- Ratio below 50: gold is cheap relative to silver. Favor gold or hold cash.
Some collectors swap metals at ratio extremes. If you bought silver at a ratio of 120 in 2020 and traded it for gold at a ratio of 65 in 2022, you nearly doubled your gold holdings without spending a dollar. This works because the ratio reverts. It does not stay extreme.
Premiums Have Their Own History
Spot price is half the story. The premium over spot, what you pay above the metal's melt value, has its own cycle that often moves opposite to price.
In April 2020, silver spot dropped to $12 while American Silver Eagles carried premiums of $8 to $10 per coin. You paid $22 for a coin holding $12 of metal. By 2022, with spot near $22, those same eagles carried premiums of $4 to $6. The all-in price barely moved even though spot doubled.
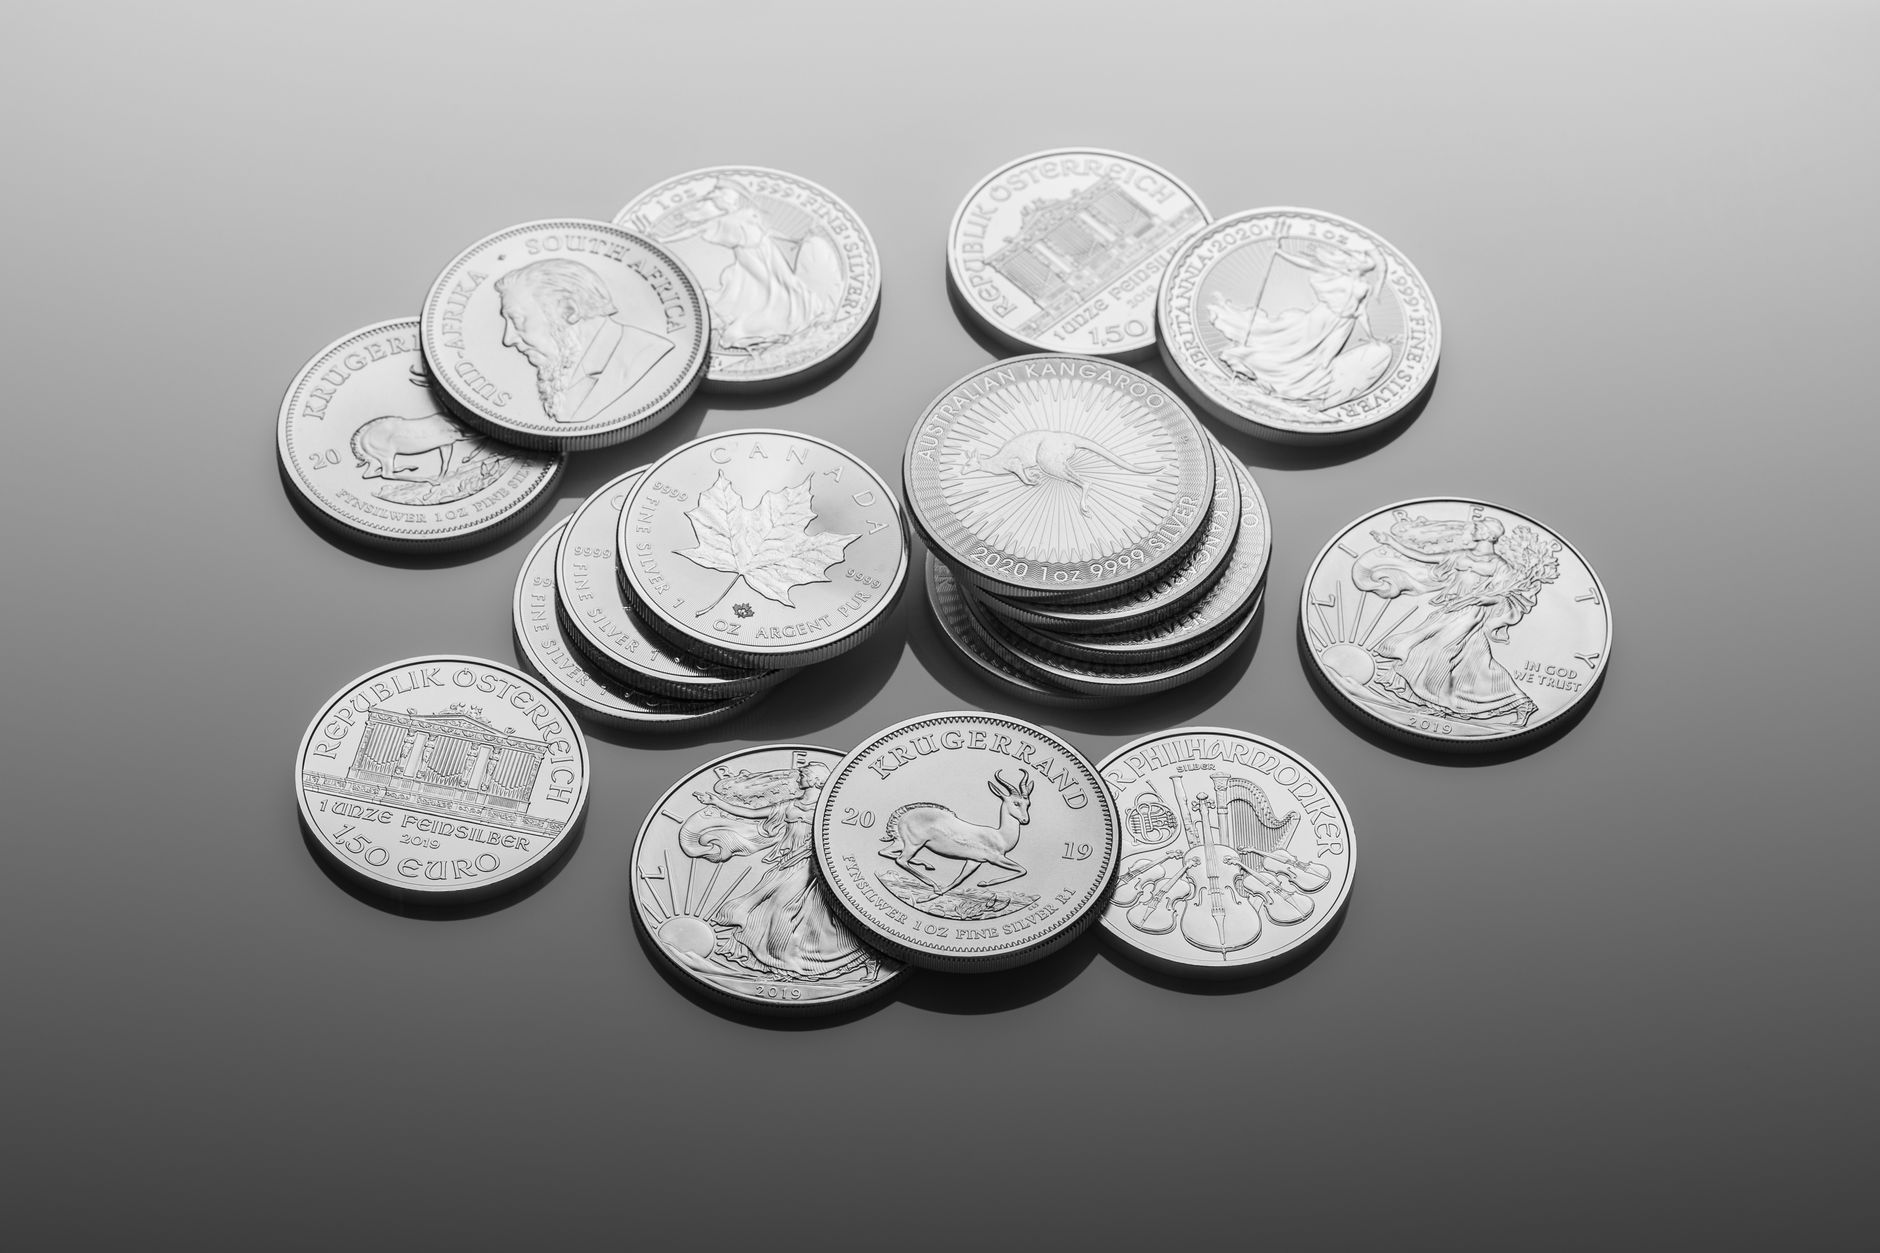
Track these premium ranges for the most common buys:
- Generic silver rounds, 1 oz: $2 to $4 over spot in normal markets
- American Silver Eagles, 1 oz: $4 to $8 over spot
- 90% junk silver, per dollar face value: spot times 0.715, plus $0.50 to $2 per dollar face
- 100 oz bars: $0.50 to $1.50 per ounce over spot
If you see eagles at $10 over spot, the retail market is panicking. That is a sell signal for paper traders and a wait signal for buyers. If you see eagles at $2 over spot, dealers are dumping inventory, and that is when you back up the truck.
How To Use This History Without Overthinking It
You do not need to time the bottom. You need to avoid buying the top. Three rules pulled from 50 years of data:
First, set a price ceiling and stick to it. Pick a number from the inflation-adjusted history, say $32 per ounce, and refuse to buy above it. When silver runs to $40, you wait. When it pulls back to $28, you buy.
Second, dollar-cost average through the boring months. Silver's biggest gains happen in 20% of trading days. The other 80% feel like nothing is happening. Set a monthly purchase amount, usually 1% to 5% of your total metals budget, and execute regardless of headlines.
Third, watch the COT report. The Commodity Futures Trading Commission publishes the Commitment of Traders report every Friday. When commercial traders (the bullion banks) hold their largest net-short positions, prices often peak within weeks. When they cover those shorts, prices often bottom. The data is free at cftc.gov.
Where To Pull Reliable Silver Price Data
Skip the YouTube charts. Go to the source.
The LBMA Silver Price publishes the daily benchmark fix at lbma.org.uk. This is the institutional reference price banks and refiners use. The Silver Institute publishes annual supply and demand data at silverinstitute.org, including the World Silver Survey, which costs about $175 but contains data you cannot get elsewhere. The U.S. Geological Survey publishes mine production statistics at usgs.gov for free.
For real-time spot prices, use Kitco or APMEX. For long-term historical charts, FRED at fred.stlouisfed.org gives you 50-plus years of free data you can download as CSV. For the gold-silver ratio, MacroTrends offers a clean 100-year chart at no cost.
Avoid sites that pair price charts with "buy now" buttons unless you have already cross-referenced their spot quote against LBMA. Some dealers mark spot up by 1% to 2% on their own site before adding premium, which inflates your apparent cost.
What The Next Five Years Likely Look Like
Nobody knows the price next month. The structural picture for the next five years is clearer.
Solar panel silver loading per watt has dropped from 130 milligrams in 2010 to about 80 milligrams in 2024. Solar installations have grown faster than that reduction, so total solar silver demand keeps rising. The Silver Institute projects solar will consume 270 million ounces annually by 2030.
Mine supply is not keeping pace. Roughly 70% of silver comes as a byproduct of copper, lead, and zinc mining. Silver-specific mines are rare and slow to develop. New projects take 10 to 15 years from discovery to production.
Above-ground inventories at COMEX and LBMA vaults have fallen roughly 30% since 2021. When registered COMEX inventory drops below industrial monthly demand, delivery stress shows up in lease rates first, then in spot price.
Your next move is simple. Pull the 50-year silver chart from FRED tonight. Mark your buy zone below the real-dollar median. Set a calendar reminder to check the gold-silver ratio every Friday. Then reserve your first piece at /reserve/ and start building a position the history says will reward your patience.
Related
- How To Track Silver Price Daily
- Silver To Gold Ratio Explained How To Use It
- Silver Spot Price Explained What It Means
Read next: How To Track Silver Price Daily