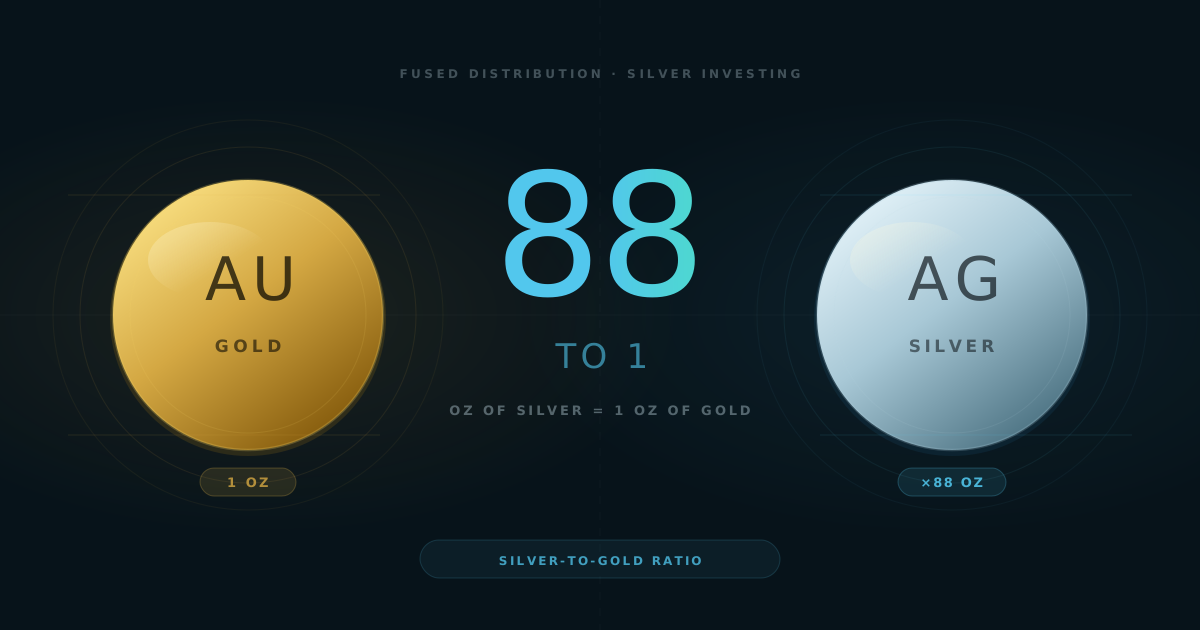
The gold-to-silver ratio is one number that precious metals investors track more than almost anything else. Divide the current gold spot price by the current silver spot price and you get the ratio. As of May 2026, it sits at roughly 60:1, meaning one ounce of gold buys about 60 ounces of silver.
That number sounds simple. What you do with it is where it gets useful.
How the Math Works
Take gold's spot price. Divide by silver's spot price. That's it.
At 60:1, one ounce of gold buys approximately 60 ounces of silver at current prices. The ratio updates constantly as both metals trade throughout the day.
When silver falls in price relative to gold, the ratio climbs. When silver gains ground faster than gold, the ratio drops. The ratio doesn't tell you whether either metal is cheap in absolute terms. It only tells you how they're priced against each other.
Where the Ratio Has Been
The range over the past century is wide. The 50-year average sits at roughly 60:1, but the ratio has swung far above and below that mark at different points in history.
The 2020 spike is a useful case study. When the pandemic hit, gold held up as a safe haven while silver dropped alongside industrial metals. The ratio blew out to 125:1, its highest modern reading. Investors who noticed that extreme and bought silver in the months after did well. By late 2025, the ratio had settled back into the low 80s as silver recovered significant ground.
The chart below shows how the ratio has moved across five key moments in history.
How Investors Actually Use It
The ratio is a relative value signal, not a buy or sell command. When it's high, silver is cheap compared to gold. When it's low, gold is cheap compared to silver. Most serious stackers use a simple framework built around two thresholds.
Silver is historically undervalued relative to gold. Many investors shift new purchases toward silver at this level, or consider trading some existing gold positions for silver. Ratios above 80 have preceded most of silver's strongest multi-year runs.
Gold is historically undervalued relative to silver. Investors who accumulated silver during a high-ratio window often use this level to consider rebalancing some silver back into gold. It does not mean silver is done going up, only that the relative value gap has closed.
The 2020 to 2024 cycle is a clear example of this in practice. Investors who saw the ratio at 125:1 in March 2020 and bought silver over the following months rode it from extreme undervaluation back toward normal. The ratio fell from 125 to the low 80s over four years as silver significantly outpaced gold's gains.
Where Things Stand Now
At roughly 60:1 in May 2026, the ratio is sitting at its 50-year average. That is neither a flashing signal to pile into silver nor a reason to hold back. Silver is fairly priced relative to gold by this measure.
For someone adding silver through a program like Fused Reserve, this is a normal environment. The ratio isn't screaming a once-in-a-decade opportunity, but it also isn't suggesting silver is expensive. Steady accumulation at a fair ratio is exactly how most long-term holders build their position.
What This Signal Won't Tell You
The ratio measures relative value only. A ratio of 80:1 when both metals are falling hard is a different situation from 80:1 when both are rising. The number compares silver to gold, not either one to the broader market or to inflation.
It also does not give you a sell signal on its own. Most investors who use the ratio as a buy signal for silver then watch for the ratio to fall sharply before considering moving some of that silver back into gold. That second move requires active attention. Simply buying when the ratio is high and ignoring it after isn't the full picture.
Fundamentals matter too. Silver's price is driven by industrial demand, mining supply, monetary policy, and physical market dynamics that the ratio ignores entirely. Treat it as one input among several, not the only thing that matters.
Sources
- MacroTrends, 100-year historical gold-to-silver ratio chart, used for historical data points.
- JM Bullion, Gold-to-silver ratio charts and historical context.
- Britannica Money, Historical analysis of the ratio including the 1980 Hunt Brothers low and 2020 peak.
- CBS News, Analysis of the 80/50 rule as an investment framework for silver allocation.
- Fortune, Current silver spot price as of May 1, 2026.