Follow the material before comparing production → Read the mine production definition
Read the refinery production definition → Test a proposed comparison for overlap
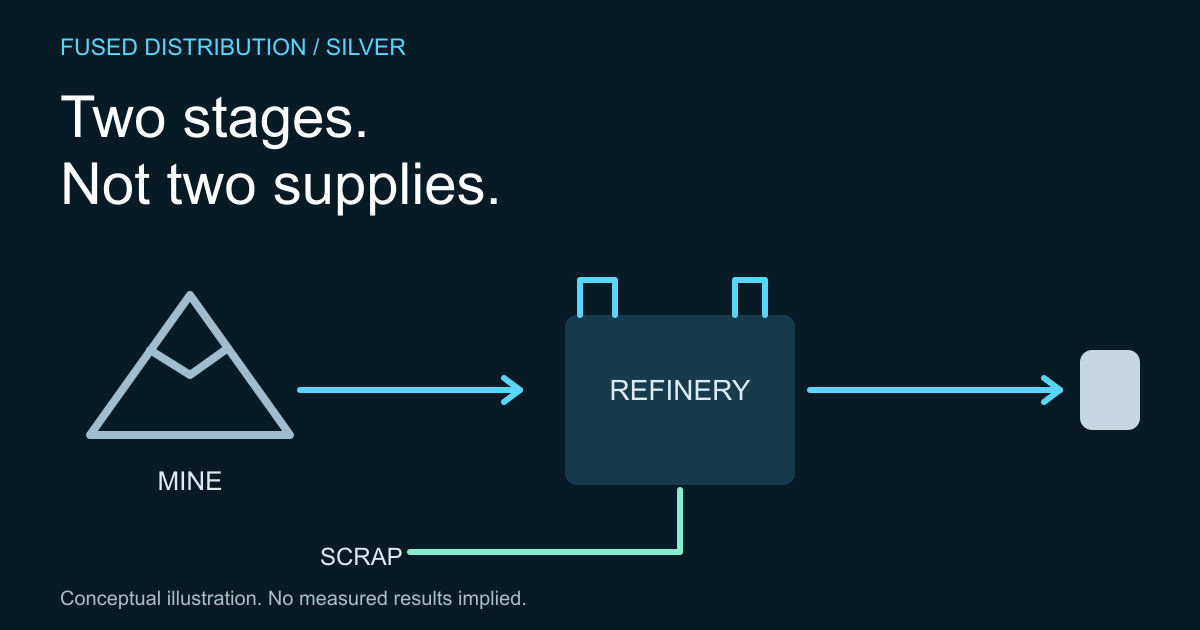
Silver mine production and refined production measure different stages of material activity. A mining figure concerns silver recovered from mining; a refinery figure concerns output from refining. Do not add the two simply because both are expressed as silver quantities. Some of the same material can pass through both stages.
The USGS silver summary separates mine production from refinery categories, including secondary material. This article explains a reading method rather than reproducing current totals. It does not calculate a supply deficit or predict a price. A valid numerical comparison requires the definitions, coverage, periods and units of the actual tables being compared.
Follow the material before comparing production
Draw a simple conceptual route from mined material through processing to refined output. Then add a separate route for recycled material where the source definition includes it. This sketch is a way to identify possible overlap. It is not a complete industrial flow diagram and should not imply that every facility or dataset follows the same boundary.
A mining statistic is not automatically a count of finished bars available to a particular buyer. Likewise, output from a refinery is not automatically evidence that all its feed material was mined in the same country or during the same reporting period. Check the source's explanation before attaching either interpretation to a number.
For a concrete reference, the USGS 2024 silver summary distinguishes mine and refinery production in its historical table. Use it to examine category structure, not as a current market update. Preserve the edition whenever you cite a particular row.
Read the mine production definition
Record exactly what the source calls the measure. Note the geography, reporting year and whether the quantity refers to contained silver rather than the total mass of ore or another material. Do not silently replace the source wording with a broader term such as “all available silver.” That wording can change the claim substantially.
Keep any estimate marker and footnote attached to the value. If you extract a row into a spreadsheet, copy its label and unit as separate fields. A number in a column headed only “production” is difficult to audit later because the key distinction has already been removed.
Our guide to reading a USGS silver summary describes an evidence worksheet. Use one row per source measure. Leave an unresolved definition visible until it has been checked rather than making an assumption to complete a chart.
Read the refinery production definition
Look for the refinery categories actually used in the publication. A label identifying primary or secondary production needs its own explanation. The cited USGS table identifies secondary production with new and old scrap. That distinction matters because a refinery total can describe more than material newly extracted by mines.
Check whether the table reports a total or a component before combining entries. If one row already includes another, adding them creates double counting. The layout of a table is not a reliable substitute for reading its definition. An indented row, footnote or explanatory sentence may establish a relationship that disappears when the data is copied elsewhere.
Record the facility or geographic boundary separately from the origin of the material. Those are different attributes. If the source does not explain the origin of refinery feed, do not fill the gap by assuming it is domestic. Report the narrower observation that the source actually supports.
Test a proposed comparison for overlap
Before calculating anything, write the proposed equation in words. Explain what each term adds and why it does not duplicate another term. If you cannot do that, keep the figures side by side with their definitions rather than combining them into one apparently authoritative supply total.
An explicitly hypothetical example can reveal the problem without inventing industry statistics. Imagine one unit recorded at a mining stage and later recorded at a refining stage. Counting those stage observations as two independent units of newly available material would misdescribe the example. Real datasets require their own definitions to establish whether and how such overlap occurs.
The same caution applies across periods. A table may use annual totals while another reports a partial year or a different reporting boundary. Matching units alone does not make those values comparable. Resolve the period and category questions before you interpret the size of a difference.
Explain the result without forecasting prices
A sound note states the source, edition, two definitions and the limits of the comparison. It can conclude that the measures answer different questions. That is a useful result; the comparison does not need to produce a market prediction to justify the work.
If your question concerns a particular silver application, separate it from this production accounting. Our article on silver in electrical contacts explains material use without claiming a market total. Application knowledge and production statistics can complement one another, but neither supplies missing definitions for the other.
Keep the source files or stable links with your worksheet. When a later edition revises a value, you can then distinguish a changed number from a changed definition. That makes the analysis easier to update and prevents an old copied chart from becoming detached from the evidence behind it.
Sources
- USGS silver summary, 2024 edition: historical category definitions, not current totals.
Related
Read next: Keep the table's labels with its values.