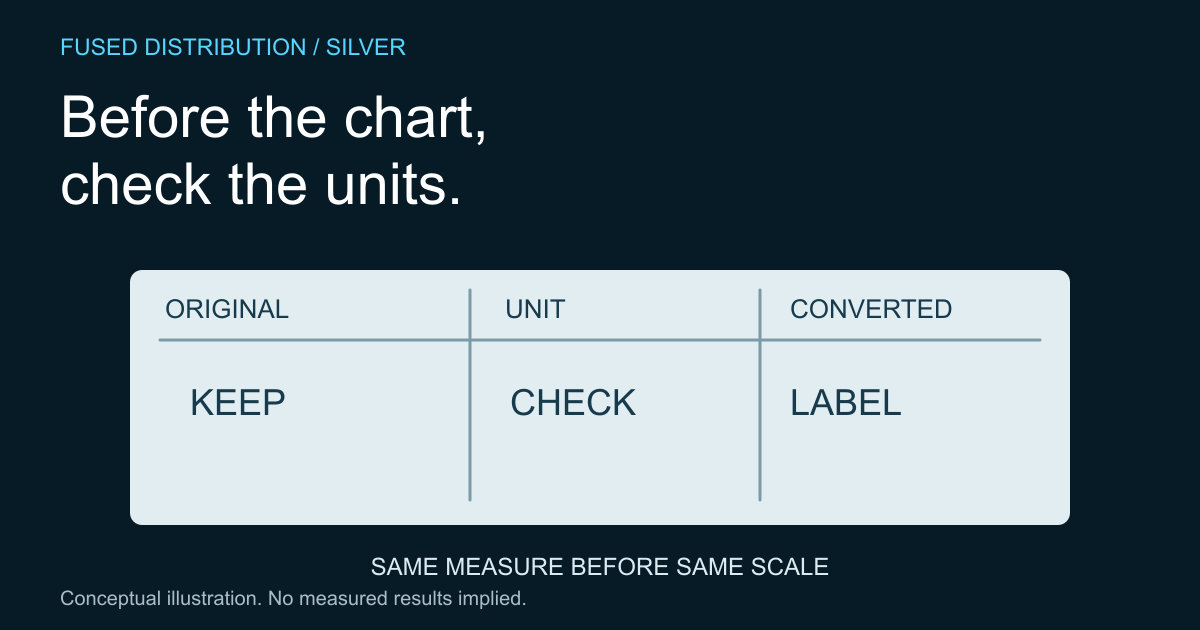
Check the scale before converting → Confirm that the quantities match
Make rounding visible → Review the comparison before sharing it
A silver statistic without a unit is incomplete. Before comparing two figures, record the unit exactly as the source presents it, including any multiplier in the table heading. Then identify what is being measured. A mass of material and the silver content of that material are different quantities.
This article explains a comparison worksheet rather than presenting current supply totals or price predictions. Start with the original publication whenever possible. The USGS silver information page links to statistical publications, but the definitions in the particular table remain essential to any calculation.
Check silver statistics for scale before converting
A heading can express values in individual units, thousands or another stated scale. Copy that wording into the worksheet. An apparent difference may come from the scale of presentation rather than the underlying measure. Do not assume that a chart copied from another source preserved the original heading.
Keep the original value unchanged in one column and put any converted value in another. Record the conversion rule and its source. This makes the arithmetic reviewable and avoids losing the evidence needed to correct an error. If a unit name is ambiguous, resolve it before performing the conversion.
Confirm that the quantities match
Matching units does not establish that two figures measure the same thing. Check the reporting period, geography, material category and whether the figure refers to contained silver. A valid mass conversion cannot turn two different statistical concepts into equivalent measures.
Our guide to reading a USGS summary explains preserving table context. Use the same discipline for estimates and footnotes. A qualification that disappears during copying can be more consequential than a small arithmetic difference in the converted value.
Make rounding visible
Retain enough detail in your working calculation to reproduce it, then choose an appropriate presentation precision. Avoid adding decimal places that suggest more certainty than the original estimate supports. Label a rounded display so it is not mistaken for the exact working value.
When explaining the result, distinguish source data from your calculation. The distinction between mine and refinery production shows why the category must stay attached to the number. A converted statistic supports only the measure actually defined.
Review the comparison before sharing it
Ask another reader to trace one displayed result back to the original value, unit and conversion. They should be able to identify the edition and reporting period without guessing. If that path is unclear, improve the worksheet before publishing a chart.
A useful final note names the two measures, explains the conversion and states any remaining limitation. When categories or periods do not align, show the figures separately with that explanation. Do not force them into a percentage comparison merely because a spreadsheet can produce one.
Sources
- USGS silver statistics and information. Source context is distinguished from the original practical method above.
Related
Read next: How to read a usgs silver commodity summary.